
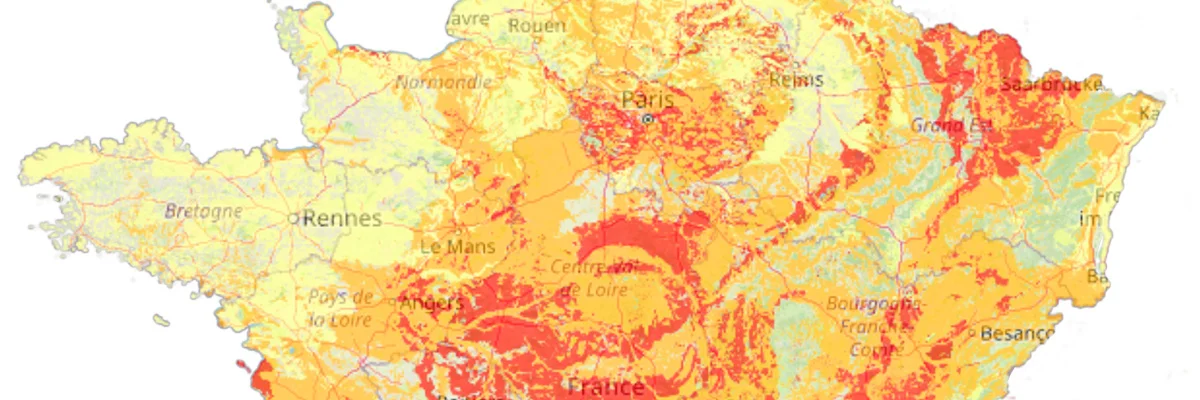
A more precise 2025 map
The RGA map classifies areas according to their exposure to clay soil movement during drought and subsequent rehydration. The 2025 version incorporates more recent data and a finer grid: it better reflects the current reality.
In plain terms: more areas are now rated "medium" or "high". A home may therefore be more exposed today than it appeared to be on the previous map.
Why a new RGA risk map in 2025?
The previous mapping was based mainly on the 1989–2017 record. But recent droughts have driven claims sharply upward: around 240,000 RGA claims between 2018 and 2022 (a major share of the historical total).
As a result, a map based on older data can underestimate the risk. The 2025 update brings the reference framework up to date with what homeowners are already experiencing on the ground.
In figures: 240,000 RGA claims between 2018 and 2022, over €3.5 billion in costs for the 2022 drought alone, and around €1.1 billion per year in recent years.
This map change is a clear signal: RGA is spreading and intensifying. If you haven't checked your exposure recently, it's important to do so.
Why is RGA a major issue for single-family homes?
Clay shrink-swell subsidence is today the costliest phenomenon under the natural disaster compensation scheme. Single-family homes are particularly vulnerable because they generally have lighter foundations than apartment buildings, making them more sensitive to differential ground movement.
This external damage is not covered by insurance, and for affected homes not located in areas declared a natural disaster (Cat-Nat), the necessary repairs can exceed the value of the house.
What this can cause: differential ground movement beneath the house, progressive damage (deformation, doors and windows that stick, etc.), and in severe cases, heavy and very costly works.
The stakes: don't discover the risk too late.
What regulatory framework applies in RGA zones?
In medium and high RGA zones, new constructions must comply with reinforced rules (soil surveys, adapted foundations, water and vegetation management). The 2025 map expands these zones: more projects and municipalities are affected.
Even for an existing home, knowing your exposure zone helps make the right decisions: maintenance, drainage, vegetation, and prevention before damage sets in.
What does the new 2025 RGA map actually change?
The 2025 update leads to a significant increase in areas classified as medium or high exposure.
This shift marks a change of scale: the phenomenon now affects a majority of France's single-family housing stock.
2020 map vs. 2025 map comparison: territory affected: 55% in 2025 (vs. 48% in 2020); exposed single-family homes: 12.1 million in 2025 (vs. 10.3 million in 2020); share of housing stock: 61.5% in 2025 (vs. 52.5% in 2020); increase: +1.8 million single-family homes affected.
A home can therefore be classified at a higher risk level without having yet suffered any visible damage.
How to interpret the new RGA risk mapping?
The 2025 map is finer and accounts for more recent claims history. It mainly serves to answer a simple question: is your municipality more exposed than before?
Important point: a reclassification does not mean a problem is certain, but that the probability is increasing — and it's better to know early.
Where to consult the new 2025 RGA map?
The official map can be viewed on Géorisques. Data is also downloadable by department.
If you checked your exposure several years ago, the 2025 update may change the result.
How to understand your RGA exposure level?
The map gives a first answer, but a home is not just a point on a map: foundations, environment (water, vegetation) and local history also matter.
The most useful approach is to start with the official exposure level, then refine it if needed.
Frequently asked questions about the 2025 RGA map
Why is my home now in a medium zone when it used to be in a low zone? The 2025 map incorporates more recent data (up to 2022). If your area has experienced more episodes of drought and claims, the classification may have moved upward.
Does the new map apply to existing buildings? Yes. It serves as a reference to inform homeowners and assess exposure. For new builds, it also influences the rules to follow in medium and high zones.
What solutions exist for homes in high or very high zones? The goal is to limit moisture variations around the foundations and reduce ground movement: water management, vegetation, maintenance, and stabilization solutions adapted to each case.
Conclusion
The 2025 RGA map shows a clear increase in risk: 55% of the territory and 12.1 million homes are now in medium or high zones. In this context, checking your exposure is a simple habit to avoid unpleasant surprises.
Sources and references
Official map and data: georisques.gouv.fr. Regulatory context (construction / RGA): ecologie.gouv.fr. Summary article (2025 map consultation): banquedesterritoires.fr.
Is your home in a clay area?
Enter your address and get your RGA risk level in 2 minutes — official BRGM data.