
Updated maps, a reading that needs completing
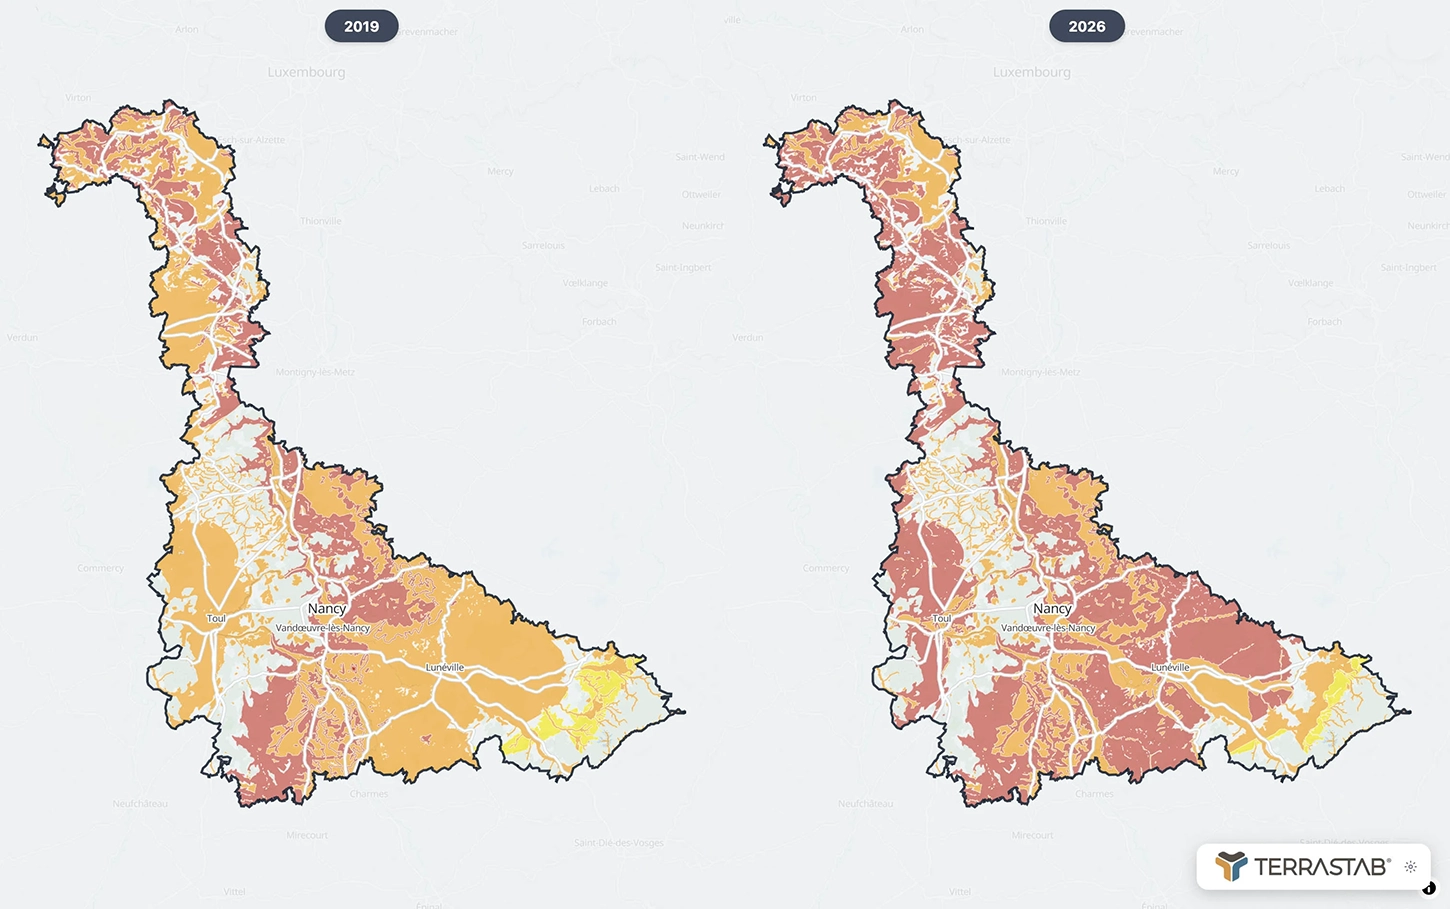
An updated version of the national clay shrink-swell subsidence map was published in 2026 on Géorisques, more precise than the 2019 version. In the Grand Est, regional press documented the change: zones classified as high-risk expanded measurably in Moselle, Meurthe-et-Moselle and Bas-Rhin.
But a map remains a geographic representation. It doesn't say how many homes are affected, or whether the expanded zones are built-up or agricultural. To understand the real implications, the mapping must be cross-referenced with housing stock data.
Grand Est: a measurable regional increase
The sedimentary basins of Lorraine and Champagne concentrate the most sensitive clay formations. The 2026 map shows a significant expansion of high-risk zones, continuing from areas already identified in 2019 but with notable geographic extension.
The increase in the absolute number of homes now in the high-risk zone reflects a reality that map-reading alone cannot capture. The issue isn't just the reclassified surface area — it's its overlap with the built environment.
The department-by-department increase in surface area helps grasp the geographic scale of the reclassification. Cross-referenced with housing data, it gives the share of the regional housing stock now exposed to the high-risk level — turning a technical update into operational data.
Focus on Meurthe-et-Moselle
Meurthe-et-Moselle has particularly sensitive geology: Triassic and Jurassic clays form the substrate of many towns in the Nancy basin. Between 2019 and 2026, the department recorded a significant increase in zones classified as high-risk, affecting areas that were previously classified as moderate-risk.
The comparative map makes visible the geographic continuity of the expansion: it follows a basin-wide logic, consistent with the underlying geology. Overlaying this expansion onto the housing stock — homes with shallow foundations, built before recent geotechnical regulations — shows the number of properties in the high-risk zone increasing measurably. These homes haven't physically changed. Their regulatory and insurance environment has.
For local authorities, this raises questions about updating local urban plans (PLU) and the requirements attached to reclassified zones. For insurers and engineering firms, it's a new reference point for any diagnosis or geotechnical assignment in the department.
What the figures really show
The damage reported in the press mostly concerns severe claims that have already occurred. The expansion of high-risk zones means something else: more homes fall into a category where ground movement will be more intense if a prolonged drought occurs. This isn't a guarantee of a claim — it's increased exposure, which the rising frequency of dry episodes makes more relevant to document.
Strategic reading: This cross-referencing — geological map × housing data — turns a map into an operational analysis. It's this advanced, department-by-department reading that local authorities, insurers and engineering firms have an interest in factoring into their decisions.
For homes located in the high-risk zone but with no claim on record, there's a window in which a preventive approach remains possible and economically relevant — before heavy underpinning solutions become the only option.
TerraStab develops territorial analysis tools and preventive solutions tailored to clay zones. The publication of the 2026 maps marks a turning point: the challenge is no longer just noting the expansion of risk zones, but understanding what it concretely means for existing buildings.
Is your home in a high-risk RGA zone?
Check for free in 30 seconds with our tool based on official 2026 national RGA data.